January 2002
The
Order 1 Soil Survey: Getting It Ready to Use
Soil Management in
Site-Specific Agriculture
Update on Order 1 Soil
Surveying: Issue 2 of 3
G.K. Blumhoff, SSMC
Information Systems Manager
Increasing the amount
of soil information is important when building a crop GIS to help improve
management practices. The widely available Order 2 soil surveys were developed
for general land use planning purposes and not for site-specific management
applications. Traditional methods for the more detailed Order 1 surveys are
time consuming and expensive. The November 2001 SSMC newsletter reported on an
attempt to use remote sensing data to speed up and reduce the cost of Order 1
surveys. This article focuses on data processing, compilation and preparation
of the Order 1 survey for evaluation and use.
Soil mapping was
performed on about 110 acres of agricultural land cropped in a no-till
corn-soybean rotation at the Davis Purdue Ag Center (DPAC) in Randolph County,
east central Indiana. On average, two soil scientists and one spatial
information specialist were present during the mapping period (6 days in the field).
Standard mapping techniques were used in addition to transect sampling to
delineate soil types. Basic tools included a Munsell color chart, acid bottle,
soil probe, and an experienced pair of eyes. Flagging was used to delineate
between different soil units, to help guide the direction of sampling, and for
recording the density of soil cores collected. The Order 1 and 2 soil surveys
maintain different requirements for soil descriptions (National Soil Survey Handbook). The Order 2
normally includes soil name and soil unit (Condit silt loam, Condit). The Order
1 includes the soil unit and name, great group and subgroup (Condit silt loam,
Condit, Typic Epiaqualfs).
Let us consider the site-specific
application and spatial technology aspects of the analysis process. Several
spatial data sets were utilized during the second Order 1 soil survey, they
included GPS, GIS map layers, and remote sensing data. GPS data included
points, lines, and polygons collected in the field and stored on a handheld
computer. All data sets used and created were referenced with UTM coordinates.
Typical file formats used were ".shp, .sid, and .jpeg". Other GIS
data sets used included: a digitized Order 2 soil survey produced in 1981, and
an IKONOS panchromatic image obtained on 1 June 2001 (bare soil 2001), ATLAS
Thermal infrared obtained on 5 May 1999 (bare soil 1998), 6" topographic
intervals (laser guided leveling), field boundaries, and existing tile drainage
maps. It is important to note that the thermal data were used in response to
field management issues that occurred in 2000 and 2001 that masked some of the
underlying soil conditions present in one of the fields in the project. This
was used to reduce the “noise” from past management practices (i.e. plot
research, variable crop-type residue, and varying tillage practices). As
stated, mapping procedures included the collection of polygons, polylines, and
points for every flag and soil boundary delineated. Flag locations were
referenced for location and included about 975 points mapped. It is important
to note that for every flag location mapped, a minimum of six soil cores was
collected to place soil boundary markers. Approximately 5,580 soil cores were
collected to assess soil type boundaries in the Order 1 mapping process.
After the three
fields were completely mapped and flagged, the GPS data was downloaded and
prepared for analysis and Order 1 map production. The data were displayed in
Arcview 3.2 GIS. In order to produce a final map for comparison, digitizing was
necessary to compile and clean up the georeferenced data layers. A new Arcview
extension was added and used to digitize the large number of polygon and
polyline files that existed for the three fields mapped during the soil survey.
The Arcview extension called "NWF/DEM Data Editing Extension"
(de.avx)
was the primary digitizing engine used in map data processing. The
Massachusetts Department of Environmental Management provided the extension.
The map production
process included the following GIS processing steps:
1. Georeferenced
data download and Arcview display
2. Digitize
all referenced data to create new polylines and polygons
3. Using
NWF/DEM Editing Extension, "unbuild" all digitized polygons and
polylines
4. "Building"
a single polygon from digitized data.
5. Correct
any "dead-links" in polyline data using Arcview "snapping"
function
6. Add
attribute data to polygon table to provide descriptions for Order 1 soil type
data
7. Adjust
soil type boundaries to coincide with existing image and topographic data
8. Send
polygon shape file for NRCS and Purdue faculty review
9. Revise
polygon shape file according to NRCS requirements
A few comments on the
usefulness of the GIS processing techniques and spatial data sets may be of
value to others interested in using our approach. The added spatial information
(topography and image data) aided in decision making during soil type boundary
adjustment. Mapping flag locations provided a known reference point for solving
discrepancies in soil type boundaries and a sampling density to gauge the
resolution of the data collected. The georeferenced data were digitized to
reduce the number of data files existing for the mapping exercise. Digitizing
also reduced the volume of data obtained from DGPS settings which were set at
intervals of 1 second during the mapping process. The data collection intervals
were used to document fine changes in soil type boundaries. Once the shape of
the soil type boundaries were known, they could then be digitized or
traced-over to eliminate data storage requirements. GIS processing was limited
to problems associated with several separate shape files and the type of files
saved (polygon and polyline).
For future mapping
exercises, it is recommended that only a few polyline files should be created
during the data collection process. This would eliminate storage and
organizational problems that occurred during Order 1 map production. Further,
if the NWF/DEM Editing Extension for Arcview is used, it is recommended that
only polylines be created, instead of a mixture of polylines and polygons
during field data collection. This would eliminate some problems that occurred
during the "unbuilding and rebuilding" process of creating a single
seamless polygon. Polylines require
less processing to combine and intersect than polygons. This is important where
two separate polygons share a common boundary. Thus, a seamless data set cannot
be produced unless the data are joined as to include the entire mapped area.
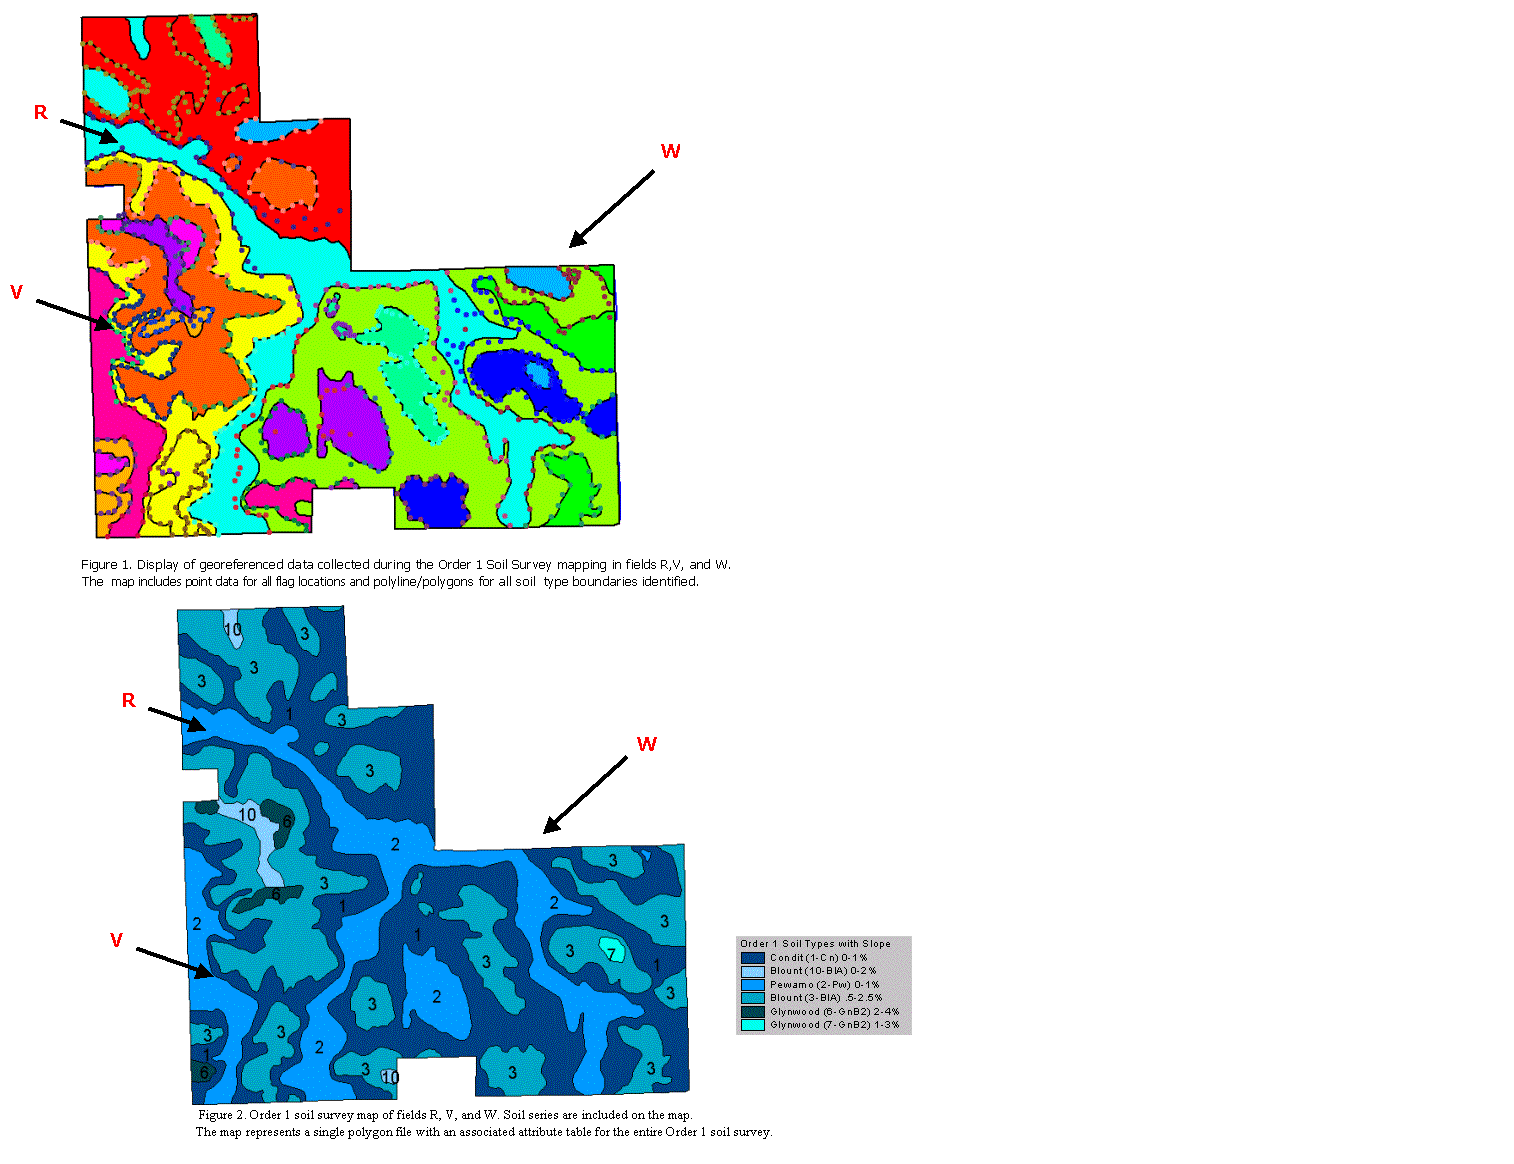
See Figure 1 for a detailed look of the GIS processing from initial
georeferenced data (points, lines, and polygons) to final approved Order 1 soil
survey shown in Figure 2.
This document is the
second in a series of three newsletters outlining the processes and comparison
of spatial data and the Order 1. The upcoming newsletter will include
information on the analysis and comparison of yield data and EC data related to
the Order 1 soil survey map.