March 2002
Introduction to the Nuts and Bolts of
Directed Crop Scouting With Remotely Sensed Data
Keywords: remote sensing, directed sampling, crop scouting
Update on Directed Crop Scouting: Issue
1 of 2
G.K. Blumhoff, SSMC Information Systems
Manager
Most commercially successful site-specific crop management has
focused on preplant decisions. Yet many of the most important crop management
decisions must be made in-season, including weed and insect control. One of the
key factors that has limited the growth of site-specific management for
in-season pest control is the difficulty and cost of obtaining timely
information on spatial patterns of pest-crop conditions. In many cases it has
been cheaper and more profitable to treat the whole field than to find out
where pests are located. Profitability and environmental stewardship could be
improved if less expensive and more effective methods were available to gather
spatial data on pests. This article outlines the development of a “How To
Guide” for the use of remote sensing to guide scouting, reducing the cost and
increasing the effectiveness of scouting.
Preplant decisions have had the advantage of allowing time for
data processing and analysis, and of making use of relatively low cost data.
The best example is the use of yield monitor data in making hybrid and variety
choices for the next season. In most cases the producer and his advisor have at
least a couple of months (e.g. October to December) to analyze the yield data
before seed orders must be placed. Once a producer has a yield monitor on his
combine and a global positioning system (GPS), the marginal cost of collecting
data is cents per acre. In contrast, in-season pest management depends on
scouting which is usually several dollars per acre and which must be repeated
at regular intervals, and it requires timely decisions. The delay of one or two
days may mean the difference between a minor problem and a disaster.
Pest sampling is essential for the accurate delineation of spatial
patterns in crop conditions. Yet, tradeoffs exist between increases in the
density of sampling, labor and the expense to collect and analyze samples, and
the resulting accuracy of maps to represent the spatial patterns in crop
conditions observed. The accuracy of these spatial patterns depends heavily
upon the initial sampling strategies that are used to map pest/crop conditions.
The primary sampling techniques for crop scouting of pests and/or crop
conditions include random, grided, or targeted sampling.
Recent availability of
high resolution aerial and satellite remote sensing technology has allowed
detailed information at a 1m to 10m spatial resolution to be collected across a
field. This information from bare soil or vegetation allows spatial patterns
based on reflectance to be accurately identified. However, note that this
technology does not directly indicate the quantitative levels of yield
influencing factors to be determined. For this reason, it is important to
identify whether these factors have high correlation to crop field conditions
measured on the ground (targeted sampling). This can be determined by sampling
field conditions and comparing to the aerial or satellite data acquired. If the
imagery and ground data are related to one another, they can be pooled to
produce a continuous map of spatial variability related to the sampled crop
field conditions.
In addition to
testing the feasibility of existing sampling methods (random sampling or zigzag
scouting), the use of targeted sampling based on secondary information such as
yield maps, soil types, and/or remote sensing has been proposed. Remote sensing
offers the potential for identifying small-scale spatial patterns in crop
conditions, crop yield across the field, and optimizing crop scouting methods
to quantify those patterns.
A step-by-step or "cook-book" procedure was
developed to incorporate remotely sensed satellite and/or aerial data for use
in directed crop scouting. Figure 1 shows a flow chart of the directed method
data processing and analysis. This summary outlines the steps to consider from
the time image data is received to diagnostic sampling in the field. It is
important to note that some data providers perform image subsetting and
rectification prior to sending the data. The image classification step can be
valuable when several differences are occurring in the original image data.
Sometimes classifying the data into 3 - 6 classes helps when trying to figure
out what major factors are causing poor crop growth conditions in certain areas
of the field. Also, these classes may in turn help during Variable Rate Map
production by providing 2 or 3 classes for herbicide application rate
decisions. Lastly, once GIS (Geographic Information System) layers have been
produced, including field boundaries and sample locations, the data can be
transferred to a handheld computer linked to GPS.
Figure 2 shows boundary layers, scouting map from
remote sensing, and the original remotely sensed data. The original raw data is
an IKONOS satellite image acquired on 24 May 2000. The raw data acquired is
displayed as a single band, panchromatic (black/white) image at 1-meter
resolution. Notice the yellow points in
the classified scouting maps. These are the directed sample locations to be
collected in the field. Also, Figure 3 shows an example software display on a
PDA (handheld) computer that a crop scout would use to navigate and assess
field crop and pest conditions.
Zigzag points Directed points (classified data) Directed points (raw data)
Figure 2. Display
of zigzag vs. directed sample locations. Zigzag samples are randomly selected
for field observation. The map of directed points used for verification of
classified and raw remotely sensed data are included.
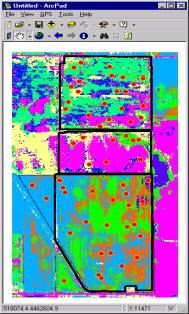
Figure 3. Software display with
scouting map, directed points, and boundary layers. This display was used to
navigate and collect data in the field.
Please check out upcoming newsletters related to
spatial data and the directed scouting method. This document is the first in a
series of two newsletters outlining the processes and comparison of traditional
versus directed sampling approaches used to assess spatial variability.
Upcoming newsletters will address estimation algorithms used to produce
variability maps and comparisons made between various sampling methods used.
For more information:
Blumhoff, Greg K., 2002. Spatial
Variability Assessment With Remote Sensing and Directed Sampling. M.S. thesis. Department
of Agronomy, Purdue University, West Lafayette, IN.